
Today's chart is the rate of change of the gold-silver ratio plotted against the ratio itself over the last 21 years (beginning of 1994 to the end of 2014).
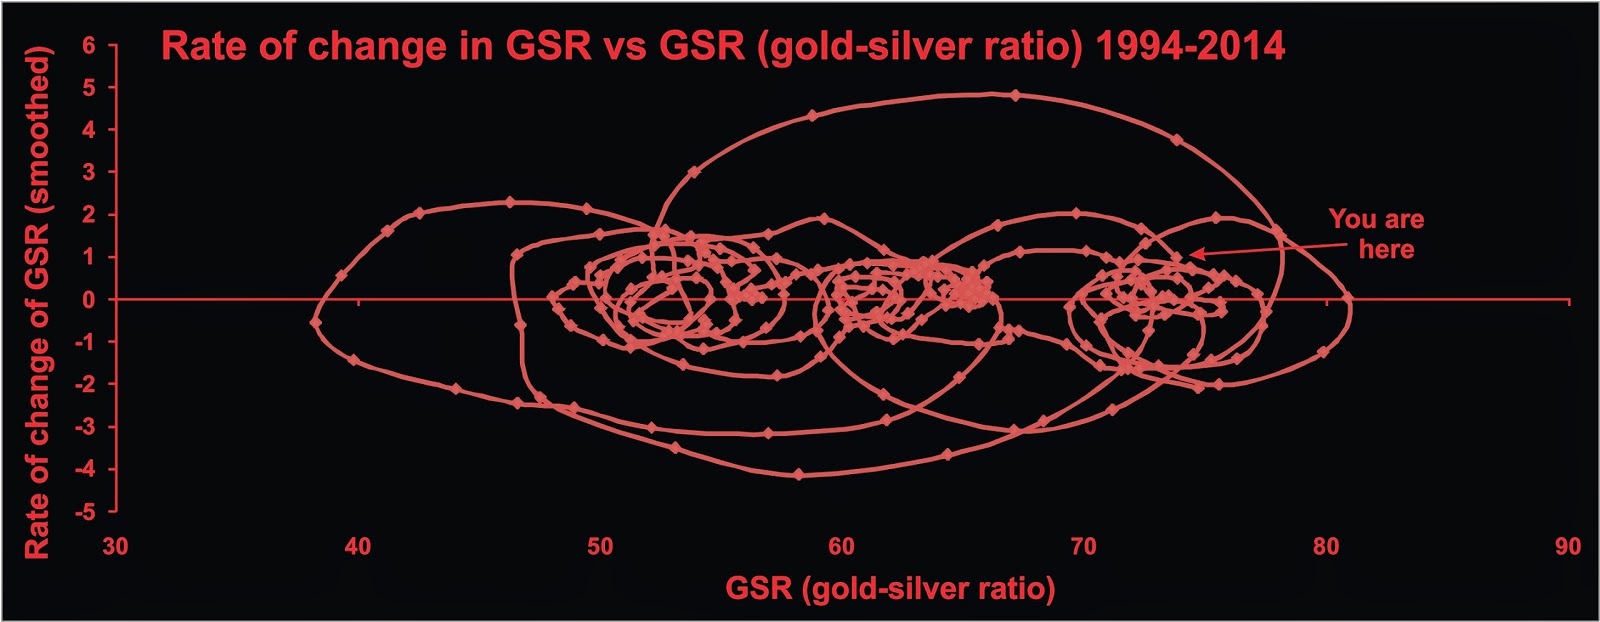
The major features are three regions of stability--one in the low 50s, one in the low 60s, and one in the mid 70s.
For stackers of both gold and silver, the lesson here is to buy silver when the ratio is in the 70s and trade it for gold when it is in the 50s (or on rare opportunities when it is lower, as in 2011). I traded about 200 oz of silver for gold at about a ratio of 45 back then, and in hindsight wish I had traded a lot more.
Concentrate more on gold when the ratio is in the 50s. Sometimes this is difficult because of all the voices clamouring for silver to "go to the moon", but that never quite seems to happen, unless the moon is $50.
No comments:
Post a Comment