
Once again, it's time for The World Complex post on Arctic sea ice extent, viewed through the lens of a reconstructed state space.
The minimum extent for sea ice this year appears to have been reached on September 17. This extent is marginally below the extent from last year.
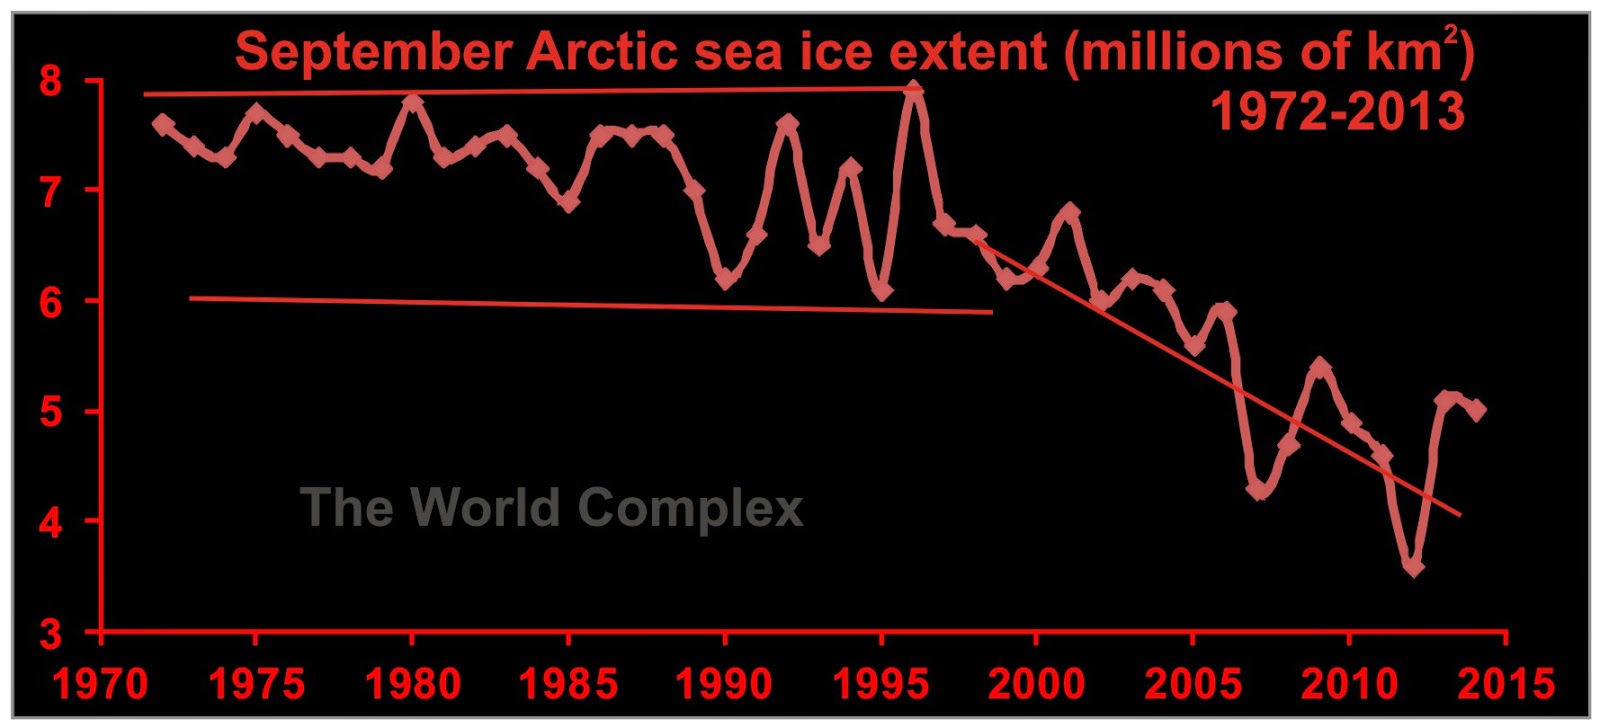
This figure has not changed significantly from last year. We see no evidence of a breakout out from the declining trend line. The slope of the trend line I have drawn is a little shallower than it was last year.

As before, I do not see any evidence to cause me to discard the hypothesis that the change in ice extent since the mid-1980s represents a change from one area of stability to another. What is still uncertain is whether this new area of stability represents a brief respite in a function that is heading to zero, or whether it is a part of normal long-term cyclical behaviour.
The horizontal lines labelled 2015 and 2016 show the level of the ordinate of the state space in those years.
The minimum extent for sea ice this year appears to have been reached on September 17. This extent is marginally below the extent from last year.
This figure has not changed significantly from last year. We see no evidence of a breakout out from the declining trend line. The slope of the trend line I have drawn is a little shallower than it was last year.
As before, I do not see any evidence to cause me to discard the hypothesis that the change in ice extent since the mid-1980s represents a change from one area of stability to another. What is still uncertain is whether this new area of stability represents a brief respite in a function that is heading to zero, or whether it is a part of normal long-term cyclical behaviour.
The horizontal lines labelled 2015 and 2016 show the level of the ordinate of the state space in those years.
No comments:
Post a Comment